Strategy Performance
Transparent metrics across all our investment approaches
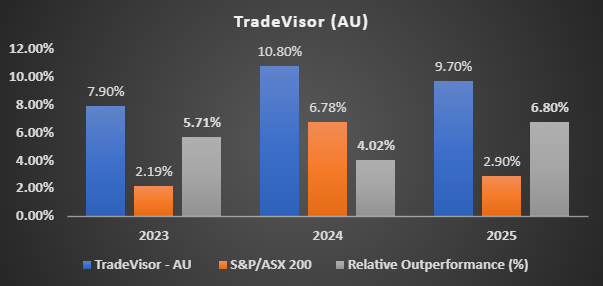
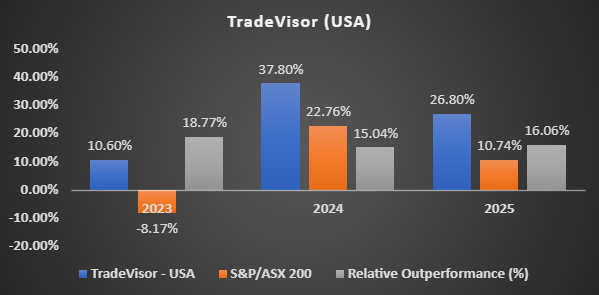
TradeVisor Performance
Our flagship quantitative strategy combining technical and fundamental factors for superior risk-adjusted returns.
| Metric | 2023 | 2024 | 2025 YTD |
|---|---|---|---|
| TradeVisor (AU) | +7.90% | +10.80% | +9.70% |
| S&P/ASX 200 | +2.19% | +6.78% | +2.90% |
| Outperformance | +5.71% | +4.02% | +6.80% |
| Metric | 2023 | 2024 | 2025 YTD |
|---|---|---|---|
| TradeVisor (US) | +10.60% | +37.80% | +26.80% |
| S&P 500 | -8.17% | +22.76% | +10.74% |
| Outperformance | +18.77% | +15.04% | +16.06% |
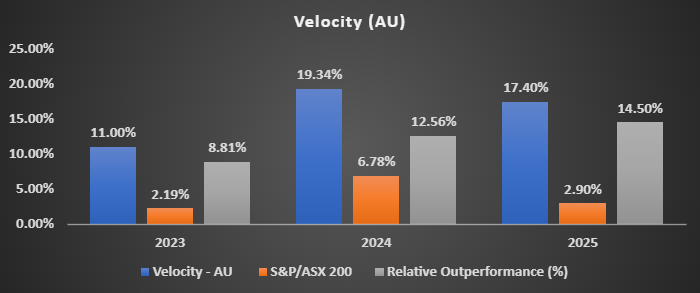
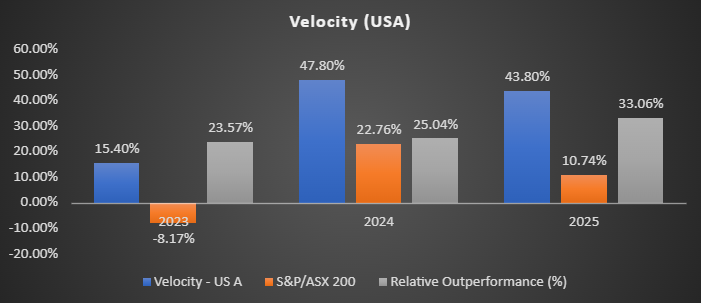
Velocity Performance
Our high-frequency quantitative strategy designed to capitalize on short-term market inefficiencies.
| Metric | 2023 | 2024 | 2025 YTD |
|---|---|---|---|
| Velocity (AU) | +11.00% | +19.34% | +17.40% |
| S&P/ASX 200 | +2.19% | +6.78% | +2.90% |
| Outperformance | +8.81% | +12.56% | +14.50% |
| Metric | 2023 | 2024 | 2025 YTD |
|---|---|---|---|
| Velocity (US) | +15.40% | +47.80% | +43.80% |
| S&P 500 | -8.17% | +22.76% | +10.74% |
| Outperformance | +23.57% | +25.04% | +33.06% |
Hidden Gems Performance
Our small-cap discovery strategy identifying undervalued growth opportunities before the market.
| Metric | 2023 | 2024 | 2025 YTD |
|---|---|---|---|
| Hidden Gems (AU) | +19.80% | +54.60% | +27.30% |
| S&P/ASX Small Ordinaries | +2.19% | +6.78% | +2.90% |
| Outperformance | +17.61% | +47.82% | +24.40% |
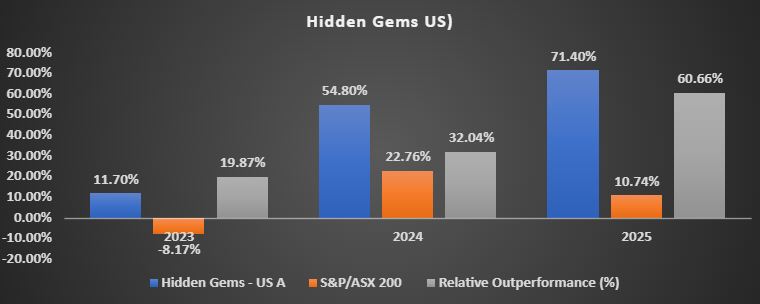
| Metric | 2023 | 2024 | 2025 YTD |
|---|---|---|---|
| Hidden Gems (US) | +11.70% | +54.80% | +71.40% |
| S&P 500 | -8.17% | +22.76% | +10.74% |
| Outperformance | +19.87% | +32.04% | +60.66% |