Weekly US Macro Recap: Sticky Inflation Revives Fed Rate Hike Risk for September
Six weeks ago, the debate inside the Federal Reserve was how quickly to cut. This week's data reopened a different question entirely: whether the next move is a hike. Nothing about that shift happened in one release. It built across five days, as inflation data, consumer sentiment and labour market indicators each landed a little worse than the story markets had been pricing, and by Friday afternoon the probability distribution around next week's FOMC decision had moved further than most economists expected it to move in a single week.

KEY HIGHLIGHTS
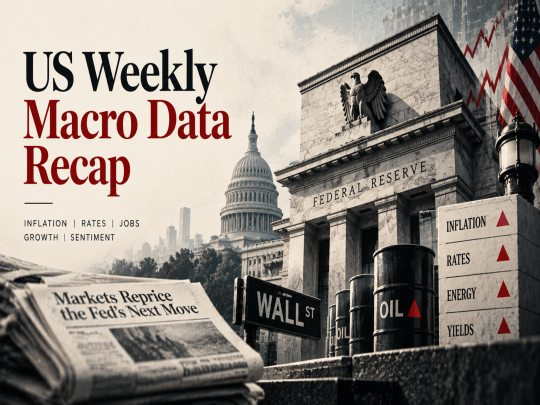
- Core CPI rose 0.3% in August, above the 0.2% consensus, holding annual inflation at 3.4%.
- Producer prices advanced 5.4% year on year, with energy costs driving the sharpest goods inflation of the year.
- The 10-year Treasury yield climbed to 4.96%, up 18bp on the week, its highest since 2023.
- Consumer sentiment fell to 47.8, a multi-year low, as inflation expectations jumped to 4.6%.
- Fed funds futures now imply a majority probability of a rate hike on September 16, reversing prior easing bets.

Entering September, the working assumption across most trading desks was straightforward: the labour market was cooling, headline inflation had drifted sideways for months, and the Federal Reserve's July decision to hold rates at 3.75 percent was a pause on the way to easing, not a wall. That assumption survived barely a week of new data. The calendar between September 7th and 11th delivered nine releases covering small-business confidence, household credit, producer prices, consumer prices and consumer sentiment, and taken individually none of them was alarming. Taken together, they describe an economy where price pressure is proving more durable than the labour-market softness meant to offset it, and where the gap between the two is now wide enough that a rate hike, not a cut, is the base case markets are pricing for September 16th.
That reassessment did not happen because of one dramatic print. It happened because the data kept confirming itself. Thursday's producer price report showed energy costs accelerating through the supply chain. Friday morning's consumer price report showed some of that acceleration had already reached households, in a core reading that beat forecast. And sitting behind both, the University of Michigan's preliminary September survey showed the public's own inflation expectations jumping to the highest level since June, at the same time confidence in the broader economy fell to a multi-year low. Each of those facts is explicable in isolation. Read as a sequence, they form the clearest case in months for why the Fed's easing cycle has stalled.
Inflation: Producer and Consumer Prices Both Ran Hot
The week's most consequential number was also its most technical: core CPI, which strips out food and energy, rose 0.3 percent in August against a consensus forecast of 0.2 percent. On its own, a single tenth of a percentage point is not a large miss. In context, it mattered a great deal, because it arrived one day after the Producer Price Index showed final demand prices climbing 5.4 percent year on year, with goods prices up 1.1 percent on the month, over three-quarters of that increase attributable to energy. Diesel alone jumped 24.1 percent at the producer level in August. That is not noise. It is the leading edge of a cost shock still working its way through the supply chain, and Friday's CPI print was the first clear evidence that some of it has already reached the checkout counter.
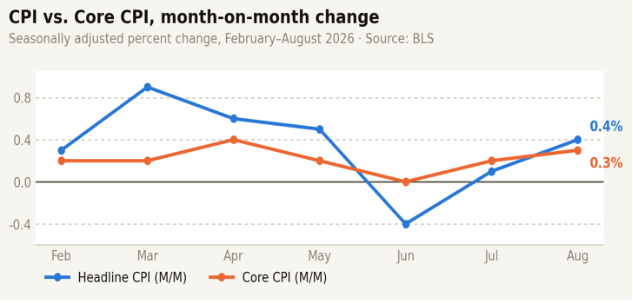
Energy is the connective tissue running through both reports. Gasoline rose 3.9 percent at the consumer level in August, accounting for over a third of the entire monthly increase in headline CPI, while the annual gasoline index is now up 27.4 percent. Shelter, typically the stickiest and most policy-relevant component of core inflation, also reaccelerated, rising 0.3 percent after just 0.1 percent in July. None of this amounts to a reversal of the disinflation trend that defined the first half of 2026. What it shows is that trend stalling out well above the Fed's 2 percent target, with fresh upward pressure now building from a direction, energy and geopolitical risk, that monetary policy has limited power to address directly.
The Week in Data: Nine Releases, One Direction
Laid end to end, the week's calendar reads less like a random walk of scheduled releases and more like a slow accumulation of evidence pointing the same way. Only two of nine readings came in cooler than forecast in a way that would argue for easier policy; the rest either matched expectations or ran hot. That ratio is what turned a routine data week into a genuine repricing event, and it is worth seeing in full before drawing conclusions from any single line. 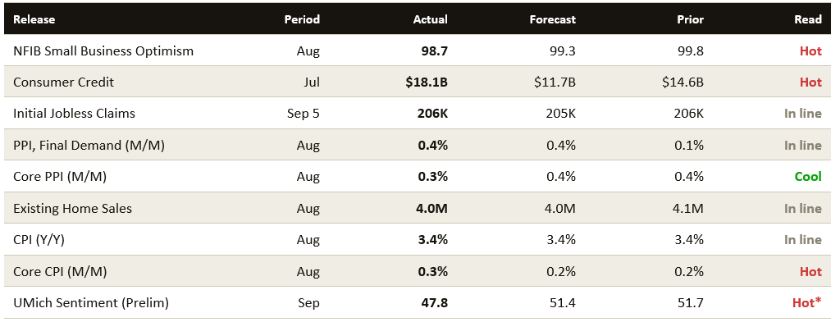
Labour, Credit and Small Business
The one part of this week's data that still points toward easier policy is the labour market, and it is worth taking seriously rather than dismissing. Initial jobless claims came in at 206,000, essentially in line with forecast and continuing a trend of low claims that stretches back to a near-60-year low of 189,000 in July. Continuing claims eased slightly to 1.774 million. Neither number shows the kind of acute deterioration that would force the Fed's hand toward cutting, and it is consistent with the view, held by some officials, that the economy remains close to full employment. If the Fed were purely a labour-market inflation-targeting machine reading this one series, a hold would be the obvious call.
But two other readings this week complicate that picture rather than confirm it. The NFIB Small Business Optimism Index fell to 98.7 from 99.8, below a consensus forecast of 99.3, with sales expectations over the prior three months turning net negative for the first time since November 2025. Sixteen percent of owners now cite inflation as their single most important problem, tied with taxes for the top spot, even as labour-cost pressures have eased to their lowest level since March 2021. That divergence between resilient headline employment and a weakening small-business outlook matters because small-business hiring and investment intentions tend to lead broader labour trends by a quarter or two; it is an early warning that arrives well before it would show up in the claims data.
Household credit told a related but distinct story. Consumer credit rose $18.1 billion in July, well above an $11.7 billion forecast and up from a $14.6 billion increase in June, with revolving balances, largely credit-card debt, up $2.8 billion on the month. A credit expansion of that size is genuinely ambiguous. It can reflect confident households borrowing to spend, or it can reflect the same households leaning more heavily on credit to absorb higher prices for fuel, groceries and other necessities while a weakening job market makes them warier of drawing down savings. The Michigan sentiment collapse, discussed below, makes the second interpretation difficult to dismiss, though this week's releases do not include the income and spending breakdown that would settle the question either way.
Consumer Sentiment: The Public Has Stopped Believing Inflation Is Under Control
If any single data point this week deserves to be read as more than noise, it is the University of Michigan's preliminary September survey. Headline sentiment fell to 47.8 from 51.7, a 7.5 percent monthly decline and the second consecutive month of contraction, with the expectations component falling harder still, down 11.1 percent to 45.8. Sentiment now sits 13.2 percent below its year-ago level and 16 percent below February, before an escalation in Middle East tension and renewed trade friction began weighing on households. That is a genuinely large move for a series that is normally sluggish month to month.
The more important number sits inside the survey rather than at the top of it. Year-ahead inflation expectations jumped to 4.6 percent from 4.0 percent, the highest reading since June, and the survey's own respondents attributed the jump to a resurgence in fuel prices and renewed tariff concerns, echoing the energy story running through this week's PPI and CPI reports. Longer-run expectations ticked up to 3.4 percent as well, ending three consecutive months anchored at 3.3 percent. Both figures sit meaningfully above their 2024 ranges. For a central bank that treats anchored expectations as a precondition for actually bringing inflation down, rather than a nice-to-have, this is arguably the least comfortable release of the week, regardless of what the current CPI print itself shows. Expectations that drift upward can become self-fulfilling, feeding into wage demands and pricing decisions well before the official data catches up.
The Fed's September 16 Decision: Markets Reprice From Cut to Hike Risk
All of this lands on a Federal Reserve that was already internally divided before the week began. The Fed holds its funds rate at 3.75 percent, within a 3.50 to 3.75 percent target range, a level defended on a fractured 9-3 vote at the July meeting, when three regional Reserve Bank presidents dissented in favour of a 25 basis point increase, described at the time as the most divided FOMC vote in years. The minutes from that meeting noted that many officials believed further tightening would be necessary if inflation failed to decelerate. August's data did not give those officials the deceleration they were waiting for; if anything, it gave the dissenting camp new evidence to work with.
Markets have responded accordingly. Reporting on CME FedWatch pricing put the implied probability of a rate hike at the September meeting near 71 to 72 percent ahead of Friday's CPI release, itself already a marked shift from the cut-leaning positioning of earlier in the year. That probability moved higher immediately after the report, with some readings citing figures as high as 88 percent following the hotter-than-expected core print. The chart below shows that shift.
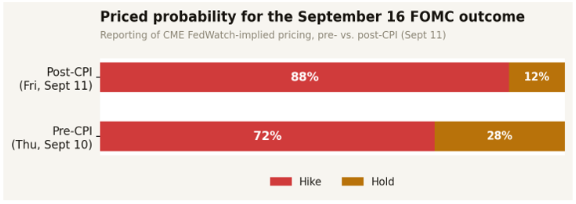
Figures reflect financial media reporting of futures-implied pricing at specific points in time, not a single verified exchange feed. Treat as directional, not exact.
The bond market moved first and moved further. The 10-year Treasury yield reached 4.96 percent this week, up 18 basis points over five trading days and its highest level since 2023, as fixed-income investors repriced a policy path that looks less like the easing cycle many had built portfolios around in early 2026 and more like a central bank preparing to defend its inflation mandate. Equity markets, tellingly, did not follow the bond market's script. Major index futures were modestly higher heading into Friday's session even as hike odds increased, a reminder that a higher policy-rate path and equity valuations do not always move in lockstep, particularly when earnings and liquidity conditions elsewhere in the system remain supportive. That divergence between bonds pricing tightening and equities shrugging it off is itself worth watching into next week, since one of the two markets is likely to be wrong.
Global Context: The Fed Is Not Tightening Alone
It would be easy to read all of this as a domestic story: a hot US inflation print, a divided Federal Reserve, a bond market recalibrating accordingly. It is not domestic. The reassessment of US policy risk lands inside a broader global pattern, and it is that pattern, more than any single American data point, that makes this week's shift worth taking seriously rather than treating as one hot print that will mean-revert next month. Energy-linked inflation tied to this year's Middle East conflict has pushed several major central banks toward tightening rather than the easing cycle many economists had expected entering 2026.
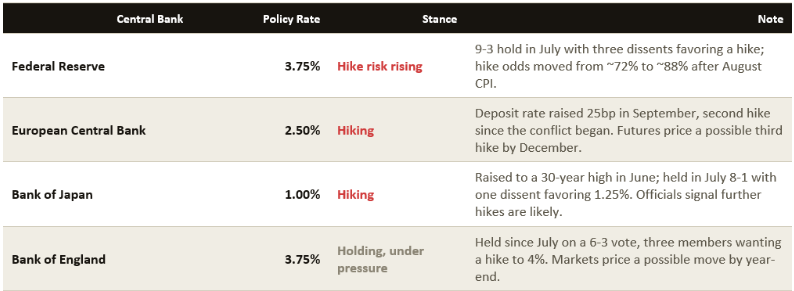
The common driver across all three is the same one showing up in this week's US data: energy costs and geopolitical risk premia feeding into headline inflation faster than labour markets are cooling. That is a materially different backdrop than a single central bank managing a domestic inflation surprise in isolation. When the Fed, the ECB and the Bank of Japan are all leaning the same direction at once, currency and rate differentials that normally offset each other tend to compound instead, which is part of why the 10-year Treasury move this week drew as much attention as the CPI print that triggered it.
What to Watch Into the September 16 Decision
None of this points to a single, certain outcome, and it would be a mistake to read this week's data as having settled the question the Fed itself has not yet settled. It points instead to a policy environment where the probability distribution around next week's decision has widened meaningfully in the space of five trading days, and where four things are worth watching closely between now and the announcement.
- Whether data released between now and the meeting reinforces or challenges current hike pricing; a single hot core CPI print is not, by itself, a reliable guide to how a committee this divided will ultimately vote.
- The tone of post-meeting guidance and the dot plot, given a July vote already this fractured. A close vote paired with hawkish forward guidance would send a very different signal than a close vote paired with reassurance.
- The interaction between a higher policy rate path and an already-elevated 10-year yield, with direct implications for mortgage rates, corporate borrowing costs and duration positioning across institutional portfolios.
- Whether the ECB's signalled December move and the Bank of Japan's continued tightening bias add further pressure to dollar-rate differentials heading into year-end, compounding rather than offsetting whatever the Fed decides.
This article is for informational and analytical purposes only. It does not constitute investment advice, a recommendation to buy, sell or hold any security, or a forecast of future asset prices. Macroeconomic data is subject to revision, and probability estimates derived from futures pricing reflect market positioning at a point in time rather than certainty about future central bank action. Readers should consult a licensed financial adviser before making investment decisions.

.png)