Global Food Prices Are Rising Everywhere at Once. Here Is Why
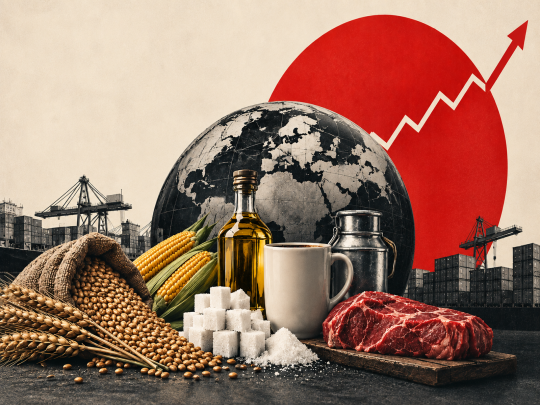
Global food prices surged in August to their highest level since 2022 as every major FAO commodity index rose together, with sugar leading a broad-based move driven by European weather damage, El Nino risk, Black Sea disruption and India's sugar import policy.

Key Highlights
- The FAO Food Price Index climbed to 133.3 points in August, its highest reading since November 2022, up 1.9 percent from July.
- All five FAO sub-indices rose in the same month for the first time in years, led by an 11.9 percent surge in sugar.
- Cereal prices gained 2.2 percent as Black Sea disruption and European weather converged on wheat and maize.
- Global cereal production is still forecast at 2.98 billion tonnes for 2026, with a comfortable stocks-to-use ratio pointing to repriced risk rather than shortage.
- Food's outsized weight in emerging-market inflation baskets carries the shock beyond agricultural markets.
Every major food category tracked by the United Nations Food and Agriculture Organization rose together in August. Cereals, vegetable oils, meat, dairy and sugar all moved higher, pushing the FAO Food Price Index to 133.3 points, its highest level since late 2022, up 1.9 percent from a revised July reading of 130.8 and 2.5 percent above a year earlier, though still 16.8 percent below the March 2022 record.
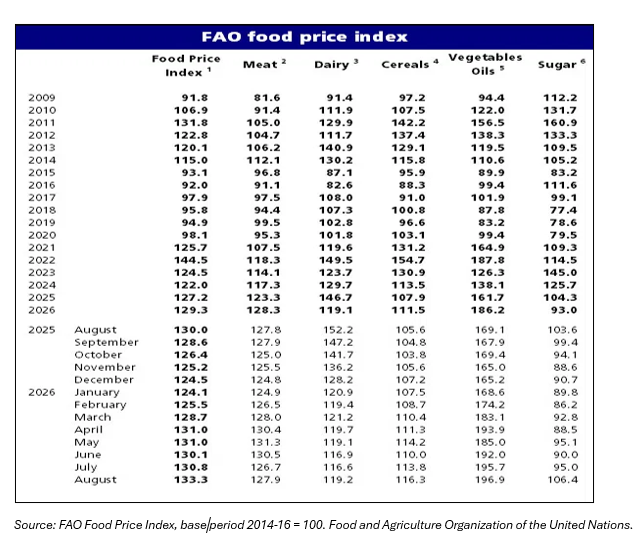
Read across the table's annual rows and 133.3 sits within the past three years' range. Read down the monthly columns for 2025 and 2026, though, and the index has climbed for four straight months, with sugar's swing from under 90 to above 106 doing most of the work. A single commodity spiking is usually local disruption; five sub-indices climbing together points to a system absorbing several shocks at once.
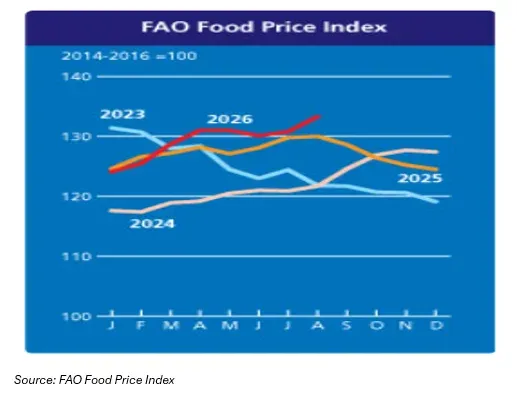
The chart above shows why that pattern matters: this year's line trailed 2024 and 2025 through the first half, then turned sharply upward from June, closing most of the gap with 2023 by August, a steady climb consistent with pressure building gradually rather than one shock landing all at once.
A Risk Premium, Not a Shortage
Global food stocks remain comfortable by historical standards. What has shifted is confidence in how reliably supply reaches buyers over coming months, on three fronts at once: weather has already reduced expected output in parts of Europe, a physical constraint; Black Sea disruption has made grain harder and costlier to move, an economic constraint; and El Nino risk in Asia has traders paying more today against the chance supply tightens later, an expectations-driven constraint. None alone would move the index much, but diversification only works when poor conditions in one region are offset by stronger harvests elsewhere, and when Europe, Brazil and parts of Asia face pressure simultaneously, supply shocks become correlated instead, reducing the system's ability to absorb losses without a price response.
Weather, Expectations and Broken Supply Lines
Persistent heat and drought across Europe has cut into prospects for wheat, maize, sugar beet and milk output simultaneously, which is why several seemingly unrelated price moves trace back to one cause. Farmers cannot expand output quickly once planting and herd decisions are locked in, a constraint economists call low short-run supply elasticity, so prices adjust once expected harvests shrink, well before harvest confirms the shortfall.
El Nino risk operates differently: FAO flagged it as a threat to palm oil and sugar output in Asia, but nothing has failed yet, so markets are pricing the probability that it might. Palm oil is especially exposed since production is concentrated in a handful of Southeast Asian countries, and because it competes with soybean, sunflower and rapeseed oil, concern over palm supply pushes buyers toward soyoil instead, helping explain why the Vegetable Oil Price Index reached its highest level since June 2022.
A third channel runs through logistics. Ukraine and the Black Sea corridor remain central to global grain trade, and FAO cited continued export-flow uncertainty behind higher cereal prices. Wheat need not vanish for its price to rise; if it becomes slower or costlier to ship, it is effectively unavailable to the buyer waiting for it, since international prices are set by exportable supply, not total production. A related pressure runs through energy: FAO linked part of the rise in maize prices to input costs following disruption near the Strait of Hormuz, since farming depends on natural gas for fertiliser and oil for machinery, and higher costs today can mean less fertiliser applied this season, risking smaller yields next season too.
Sugar Carried the Heaviest Load
No sub-index moved like sugar, up 11.9 percent to its highest level since June 2025, as four forces landed together: weaker European beet yield forecasts, El Nino risk to Asian output, a production shortfall in Brazil's Center-South region, and India's decision to allow duty-free raw sugar imports.
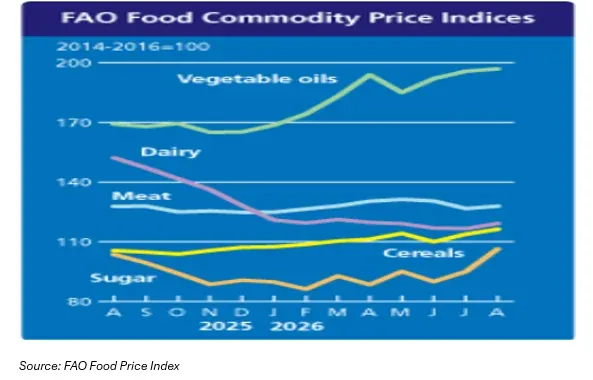
The chart above shows how sudden that move was against the rest of the complex: vegetable oils climbed steadily all year, while sugar stayed depressed below 90 through winter before spiking sharply into August, a shape that fits several shocks converging rather than one steady trend.
Brazil's shortfall matters less for total output than for exportable surplus, the tonnes actually available on the world market; when a top supplier's exports fall, importing countries compete harder for what remains, and the effect compounds when several major producers struggle in the same season.
India adds a different mechanism. Facing an estimated domestic harvest near 30.6 million tonnes, down from an earlier 34.3 million tonne projection, and rising local prices, the government approved duty-free imports to ease consumer costs at home. Internationally, the effect runs the opposite way: removing the duty made buying on the world market viable for Indian refiners, and India's scale as a producer and consumer meant that shift alone was large enough to move the global benchmark.
Most of sugar's surge originated on the supply side, but India's decision added an unusually large demand shock on top. Elsewhere in the complex, demand pressures were more explicit still: FAO noted that strong demand from the ethanol and animal feed sectors supported maize prices, since maize competes across food, feed, fuel and industrial use, and rising ethanol demand draws on the same grain pool that livestock and food producers need.
Heat, Herds and a Weaker Dollar
European heat stress also slowed pig growth, cutting the supply of slaughter-ready animals and lifting the Meat Price Index by 1.0 percent, with firmer poultry and ovine prices adding support, since herds cannot expand on short notice once numbers fall. Dairy followed a similar script, up 2.3 percent on tighter European milk supply, with raw milk feeding into butter, cheese and both powder types at once, so a single supply contraction tightens the entire downstream chain simultaneously.
One further factor had nothing to do with weather, herds or shipping: a weaker US dollar, which FAO cited as supportive for wheat, since most agricultural commodities are dollar-denominated and a weaker dollar makes the same price cheaper for buyers transacting in other currencies, lifting demand and supporting dollar prices further.
Why This Differs From 2022
FAO's cereal supply and demand assessment still projects global production of 2.98 billion tonnes for 2026, down 2.0 percent from 2025 but the second-largest harvest on record, with world cereal stocks forecast to reach 947.2 million tonnes by the close of 2026-27 and a stocks-to-use ratio of 31.6 percent, only slightly below 31.9 percent the season before.
Inventories function as the food system's shock absorber: when stocks are plentiful, a poor harvest need not be matched immediately by lower consumption, but when inventories are thin, far more adjustment must occur through price. The comfortable stocks-to-use ratio is why August's rise reads as a repricing of risk rather than evidence of outright scarcity. European weather, El Nino exposure, Black Sea and Gulf-linked disruption, Brazilian output and Indian import policy might each be manageable alone; arriving together, they shrink the system's margin for absorbing whatever comes next.
The Macro Reach of a Commodity Shock
A repricing of risk in commodity markets rarely stays confined there. Food carries a larger weight in consumer price baskets in many emerging economies than in developed ones, so the same shock generates a far larger headline inflation effect there, one currency depreciation can amplify by raising the local-currency cost of dollar-priced imports. Persistent food inflation can also influence inflation expectations, subsidy bills and the timing of monetary easing, even when core inflation stays comparatively stable.
The FAO index itself tracks international commodity prices, not what shows up on a supermarket receipt. The path to a household grocery bill runs through exchange rates, inventories, transport costs, taxes, subsidies and retailer margins, all of which vary by country. A 1.9 percent monthly move is a useful early signal of where cost pressure may surface, not a forecast of proportional grocery inflation.
FAQs
Q: Why did every FAO sub-index rise in the same month?
A: Several distinct shocks landed together, weather damage in Europe, Black Sea and Gulf-linked disruption, El Nino risk in Asia, and strong feed and import demand, pushing all five categories higher at once.
Q: Does this mean a global food shortage like 2022?
A: Not based on current data. FAO still projects the second-largest cereal harvest on record and a comfortable 31.6 percent stocks-to-use ratio, consistent with rising risk rather than confirmed scarcity.
Q: How did India's import policy affect global sugar prices?
A: Removing the import duty made buying sugar internationally viable for Indian refiners, and India's scale as a consumer meant that shift alone added real pressure to the global benchmark.
The Wall Street Wrap: September 4, 2026
Related post