Why Did the S&P/TSX Composite and S&P/TSX Venture Indices Rally, and What Drove Canadian Stocks Higher?
Canada’s stock market staged a broad-index rebound, but the rally concealed a less reassuring reality: most shares continued to struggle. Lower bond yields and a softer US dollar helped lift sentiment, while materials, telecoms, industrials and financials provided support. Technology remained under pressure amid the global AI and chip sell-off, leaving investors to weigh a welcome recovery against uneven market participation.


Canadian equities rebounded as lower domestic bond yields, a softer U.S. dollar and gains across selected sectors improved risk appetite. The S&P/TSX Composite, S&P/TSX SmallCap and S&P/TSX Venture Composite all advanced, although the gains masked uneven participation and continued pressure on technology shares.
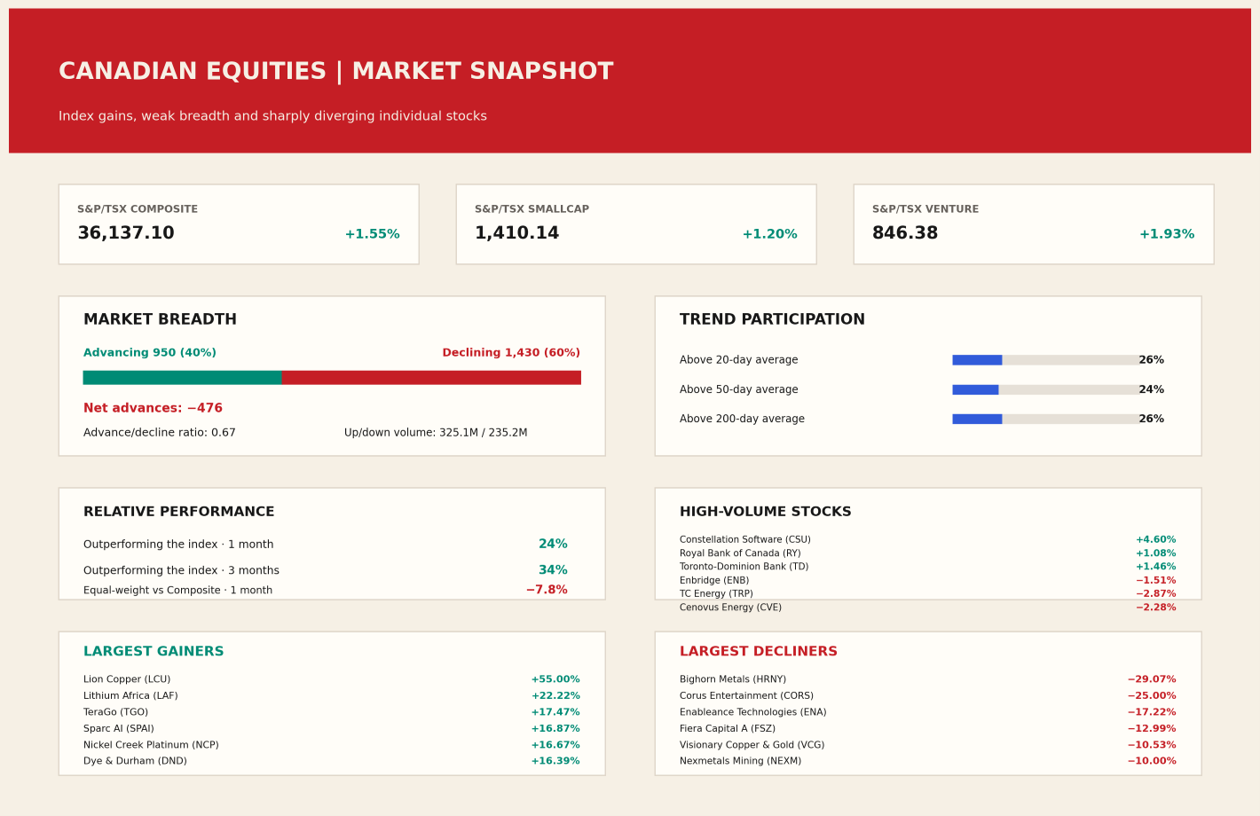 Image Source: TSX, Analysed by Thecorequant.com
Key figures at a glance
- Benchmark returns: S&P/TSX Composite +1.55%; SmallCap +1.20%; Venture Composite +1.93%.
- Breadth: 950 advancing (40%) versus approximately 1,430 declining (60%); net advances −476; advance/decline ratio 0.67.
- Volume: 325.1 million shares traded in advancing names versus 235.2 million in declining names.
- Trend participation: 26% above the 20-day average, 24% above the 50-day average and 26% above the 200-day average.
- Relative performance: 24% outperformed over one month; 34% over three months; equal-weight versus the Composite was −7.8% over one month.
Why Canadian indices rallied despite uneven market participation
The S&P/TSX Composite finished near 36,137.10, rising 1.55%, while the S&P/TSX SmallCap Index climbed 1.20% to 1,410.14 and the S&P/TSX Venture Composite gained 1.93% to 846.38. The recovery followed a weaker prior session marked by inflation concerns, pressure on precious metals and softness in bank and technology shares. Canadian 10-year government bond yields fell by roughly eight basis points to around 3.795%, improving the backdrop for interest-rate-sensitive equities and supporting a rebound in risk appetite.
A softer U.S. dollar helped support precious metals, while selective strength in materials, telecommunications, industrials and financials helped lift the benchmarks. Oil prices were mixed, leaving energy shares without a uniform direction, and technology remained under pressure amid a broader global selloff in artificial-intelligence and semiconductor-related stocks. The Canadian dollar strengthened to approximately US$0.7045. Together, these cross-market developments help explain why the indices recovered even as sector performance diverged.
The advance was nevertheless narrower than the headline gains suggested: approximately 950 stocks rose while about 1,430 fell. Market-capitalisation-weighted indices can rise when gains in influential constituents offset losses across a larger number of smaller companies. The combination of easing yields, selective sector leadership and weak overall breadth points to a relief rally rather than unequivocal evidence of a broad-based advance.
What market breadth says about risk appetite
Market breadth compares rising and falling securities. Here, 40% advanced and 60% declined, producing an advance/decline ratio of 0.67. In simple terms, falling shares outnumbered rising shares by roughly three to two. That weak participation makes the headline index gain less convincing as evidence of a broad market recovery.
The index can still rise because the S&P/TSX Composite is weighted by market value. Gains in a handful of large companies or sectors can offset declines among many smaller constituents. Persistently weak breadth can nevertheless signal that the rally is narrow and vulnerable if leadership stocks lose momentum.
Up-volume was 325.1 million shares, compared with 235.2 million shares in declining stocks. This suggests heavier traded volume in advancing names despite the larger number of decliners. Volume offers context, but it does not establish whether the session reflects durable buying or short-term positioning.
Why the smaller-company benchmarks also matter
The S&P/TSX SmallCap Index gained 1.20%, while the S&P/TSX Venture Composite rose 1.93%, the strongest percentage advance among the three benchmarks. That indicates some strength in smaller-company shares, but it sits alongside weak overall breadth.
Small-cap and venture-listed stocks can react sharply to financing conditions, commodity prices, project updates and liquidity. Their percentage moves can also be magnified by low share prices and thin trading, so a large gain should not automatically be read as a fundamental improvement.
The key test is whether a move is backed by durable developments such as revenue growth, cash generation, project progress or improved financing terms. Without that evidence, price momentum alone is a weak basis for a long-term conclusion.
A market with few stocks above their moving averages
Only 26% of stocks were above their 20-day moving average, 24% above their 50-day average and 26% above their 200-day average. These measures compare prices with smoothed trends over short, intermediate and longer periods. Read together, they suggest that the index gain was not matched by broad participation.
A sustained improvement would normally be accompanied by more shares reclaiming these averages. If the indices continue to rise while participation remains near one quarter, the market may remain dependent on a relatively small group of leaders.
The market also showed 24% of stocks outperforming the index over one month and 34% over three months. The equal-weighted market lagged the S&P/TSX Composite by 7.8% over one month, reinforcing the message that the benchmark’s strength was not evenly shared.
What the highest-volume stocks reveal
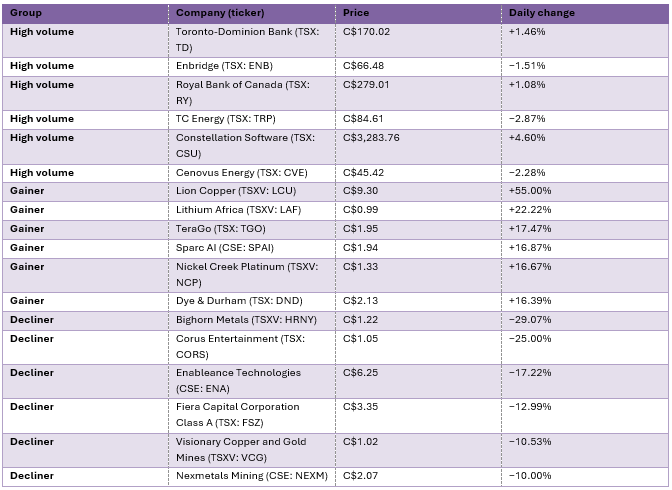
The high-volume list showed a mixed session. Constellation Software Inc. (TSX: CSU) rose 4.60% to C$3,283.76. The company acquires and operates vertical-market software businesses; no specific announcement was identified that clearly explains this session’s gain. The Toronto-Dominion Bank (TSX: TD) gained 1.46% to C$170.02, while Royal Bank of Canada (TSX: RY) advanced 1.08% to C$279.01. Both are major Canadian banks, and no stock-specific catalyst was established for either move.
Energy infrastructure and producers weakened. Enbridge Inc. (TSX: ENB), which operates energy transportation and related infrastructure, fell 1.51% to C$66.48. TC Energy Corporation (TSX: TRP), a natural-gas pipeline and energy infrastructure company, dropped 2.87% to C$84.61. TC Energy announced an Indigenous investment agreement related to Coastal GasLink on October 13, but that announcement does not by itself explain the decline recorded during the session. Cenovus Energy Inc. (TSX: CVE), an integrated energy producer, fell 2.28% to C$45.42. Cenovus had announced an agreement to acquire Athabasca Oil Corporation on October 5; the daily decline cannot be confidently attributed to that transaction.
These price changes should be read as observed moves, not automatic evidence of a particular cause. For the energy names, oil and gas prices, sector rotation, deal-related valuation questions and broader market sentiment are possible influences, but the available evidence does not isolate which factor drove each share on the day. Trading volume identifies where activity was concentrated; it does not reveal the reason for that activity.
The biggest gainers: dramatic moves, different levels of risk
The biggest gainers were led by Lion Copper Corp. (CSE: LCU), up 55.00% to C$9.30. Lion Copper announced on October 14 that it had received approval to list its common shares on Nasdaq under the symbol LCU, with trading expected to begin on October 19, subject to customary conditions. That is a material, time-specific corporate development and a plausible contributor to investor interest, although it cannot be treated as proof of the cause of the full daily move. Lithium Africa Corp. (TSXV: LAF) rose 22.22% to C$0.99; it is a lithium-focused exploration company, and no specific catalyst for this move was established.
TeraGo Inc. (TSX: TGO) gained 17.47% to C$1.95. The company provides managed fixed wireless internet, private 5G networks and software-defined wide-area networking services; no clear same-day announcement was found to explain the advance. Sparc AI Inc. (CSE: SPAI), which develops AI-enabled navigation and positioning technology, rose 16.87% to C$1.94, but a specific catalyst for this session was not established. Nickel Creek Platinum Corp. (TSXV: NCP) climbed 16.67% to C$1.33. The company is advancing a nickel-platinum-group-metals project in Yukon and announced a non-brokered private placement on October 13; the announcement is relevant context, but the share-price rise cannot be attributed to it with certainty.
Dye & Durham Ltd. (TSX: DND) advanced 16.39% to C$2.13. The company supplies cloud-based legal practice-management software. Its recent corporate updates included fiscal 2026 results and the appointment of an interim chief executive and new board chair in August; no verified announcement was identified that conclusively explains the exact daily increase shown here. These moves span resource exploration, telecom, AI technology and software. A large percentage gain can reflect a corporate announcement, changing expectations, thin liquidity or momentum, and those explanations are not interchangeable.
The biggest decliners and the need to investigate catalysts
The largest decline was recorded by Bighorn Metals Corp. (CSE: HRNY), down 29.07% to C$1.22. The company is exploring copper-gold prospects and announced a fall 2026 exploration programme on October 5. No verified announcement was identified that clearly explains the full decline recorded during the session. Corus Entertainment Holdings Inc. (TSX: CORS) fell 25.00% to C$1.05. Corus is a Canadian broadcasting and media company; it completed a recapitalisation transaction announced on October 8, with the new CORS shares beginning trading on October 13. The unusual capital-structure transition is important context, but it is not sufficient on its own to explain the day’s percentage move.
Enableance Technologies Inc. (CSE: ENA) declined 17.22% to C$6.25. It is a technology company; a reliable, specific catalyst for the move was not established. Fiera Capital Corporation (TSX: FSZ) fell 12.99% to C$3.35. Fiera is an independent asset manager, and on October 14 it reported preliminary assets under management of C$151.4 billion at September 30, down 7.4% from June 30. The decline in reported AUM is relevant context for investors, but the available information does not establish it as the direct cause of the share-price drop. Visionary Copper and Gold Mines Inc. (TSXV: VCG) fell 10.53% to C$1.02; it is a copper-and-gold exploration company, and no specific catalyst was confirmed. Nexmetals Mining Corp. (TSXV: NEXM) dropped 10.00% to C$2.07; it is a mining-development company, and no clear same-day catalyst was identified.
For any sharply declining stock, the central question is whether the move reflects a change in business fundamentals, financing risk, dilution, project execution, liquidity or short-term trading. Where a verified catalyst is absent, the responsible conclusion is simply that the stock fell by the stated percentage and a specific reason could not be confirmed. That is more useful than assigning a plausible-sounding explanation without evidence.
New highs and new lows can be compared across one-week, one-month, three-month and one-year periods. A new high can signal persistent demand; a new low can signal continuing selling pressure. Neither measure alone explains a company’s move, so it is best used alongside breadth, volume and company-specific news.
The 24% one-month and 34% three-month outperformance readings, together with the negative 7.8% equal-weight comparison, indicate that relatively few stocks were outperforming the benchmark over the shorter period. A broader rally would ideally show improvement across both these measures and the advance/decline ratio.
The next step is to test whether participation improves. A sustained rise in advancing issues, an advance/decline ratio above 1.0 and a growing share of stocks above key moving averages would offer stronger evidence of a broad recovery.
Investors should watch whether advancing shares begin to outnumber decliners, whether the advance/decline ratio moves above 1.0, and whether more stocks reclaim their 20-day, 50-day and 200-day averages. Those changes would help determine whether the rally is broadening or remaining concentrated.
At the company level, separate large, liquid businesses from smaller, more speculative issuers. For Toronto-Dominion Bank (TSX: TD) and Royal Bank of Canada (TSX: RY), relevant indicators include credit quality, loan growth, deposit costs and capital strength. For energy companies, oil and gas prices, production, costs and balance-sheet priorities matter.
For exploration companies, investors should focus on resource quality, permitting, drilling results, funding and dilution risk. For software and technology names, revenue growth, customer demand, cash flow and execution are more informative than a single day’s percentage move.
The overall conclusion is mixed: all three benchmarks advanced and up-volume exceeded down-volume, yet decliners outnumbered advancers and only about one quarter of stocks traded above key moving averages. The stock-specific examples underline the importance of verified catalysts. Where no clear reason could be established, the article identifies the business and reports the percentage move without guessing at the cause.
Full stock-mover reference
The following table lists individual prices and daily percentage changes for the companies discussed. Prices are in Canadian dollars (C$).
The Wall Street Wrap: October 15, 2026
Related post