TSX Technical Outlook: Westshore Breakout, Saturn Oil Nears Resistance, DPM Slips
The S&P/TSX Composite Index tests its 100-day EMA after a bearish moving average crossover, while the monthly RSI signals overextension. Technical analysis of Talamore Mining, Saturn Oil & Gas, Westshore Terminals and DPM Metals highlights key support, resistance and momentum levels. These levels frame the near-term outlook for Canadian equities.


Key Highlights
- The S&P/TSX Composite Index rose 0.99% to 35,502.65 as softer U.S. job growth and lower bond yields lifted risk appetite.
- A 20-day EMA crossover below the 50-day EMA leaves the index testing its 100-day EMA, with neither buyers nor sellers in clear control.
- The monthly RSI of 75.24 and a price-momentum divergence point to an overextended market that favours consolidation.
- Stock-level charts diverge: Westshore and Saturn press higher, Talamore stabilises within a range, and DPM Metals slips below key support.
The S&P/TSX Composite Index closed higher on Friday, advancing 0.99% to 35,502.65, as a marked deceleration in U.S. employment growth eased concerns over the interest rate outlook and supported a broad recovery in global equities. Softer crude oil prices further improved risk appetite, while the decline in global bond yields offered relief following the recent selloff in government debt. The firmer tone across U.S. markets has also helped Canadian equities absorb the residual weakness in metals and other commodities that followed Thursday's decline. Against this backdrop, the technical picture across the benchmark and four individual stocks offers a useful read on where momentum is building and where it is fading.
S&P/TSX Composite Index: Daily Chart Shows a Contested Trend
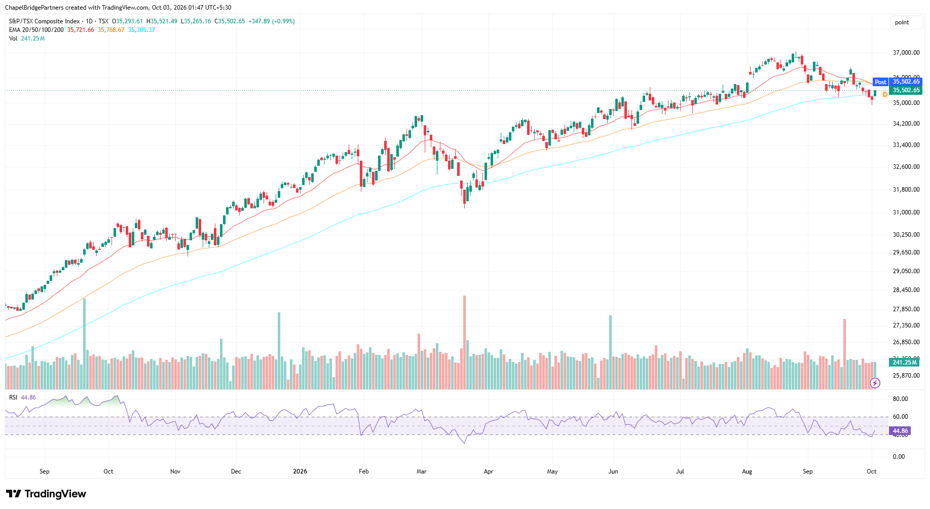
The daily chart of the S&P/TSX Composite Index shows a meaningful shift in underlying sentiment. In the previous session, the 20-day EMA crossed below the 50-day EMA, with the two averages now at 35,721.66 and 35,768.67 respectively. The index closed at 35,502.65, below both shorter-term averages and above the 100-day EMA at 35,305.37, which is currently acting as immediate support.
This support level also coincides with the 40 mark on the RSI, which stands at 44.86, a zone that has frequently marked the lower end of the RSI range during the broader advance. The volume profile for the most recent quarter places the Point of Control at the same area, which suggests scope for consolidation around current levels.
The previous attempt to rebound from this support did not succeed, indicating that both buyers and sellers retain a significant presence and that neither side has established clear directional control. The index also remains about 4% below its late-August high near 37,000. A sustained recovery above the 20-day and 50-day EMAs would be required to restore the earlier trend structure, while a close below the 100-day EMA would expose the index to a deeper corrective phase.
S&P/TSX Composite Index: Monthly Chart Signals Overextension
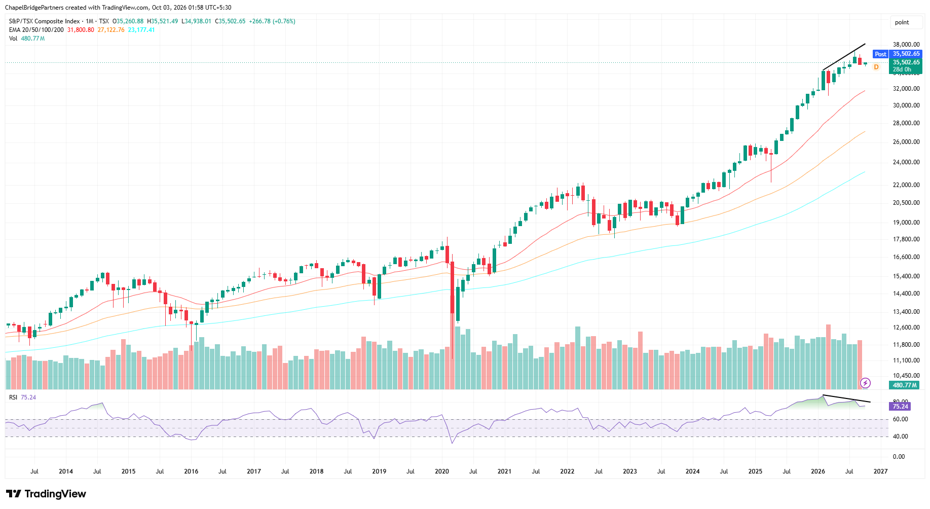
The monthly chart of the S&P/TSX Composite Index shows an overextended market, as evidenced by the RSI reading of 75.24 and by the considerable distance between price and its moving averages. The index trades roughly 12% above its 20-month EMA at 31,800.80 and about 31% above its 50-month EMA at 27,122.76.
Momentum has also weakened relative to price. The RSI peaked near the 80 level in early 2026 and has since formed lower highs, even as the index recorded a fresh high in August, which creates a divergence between price and RSI. This divergence, together with the narrowing gap between price and the shorter-term moving averages, supports the expectation of a consolidation phase on the daily chart.
Talamore Mining: Range-Bound Structure Holds at the Lower Boundary
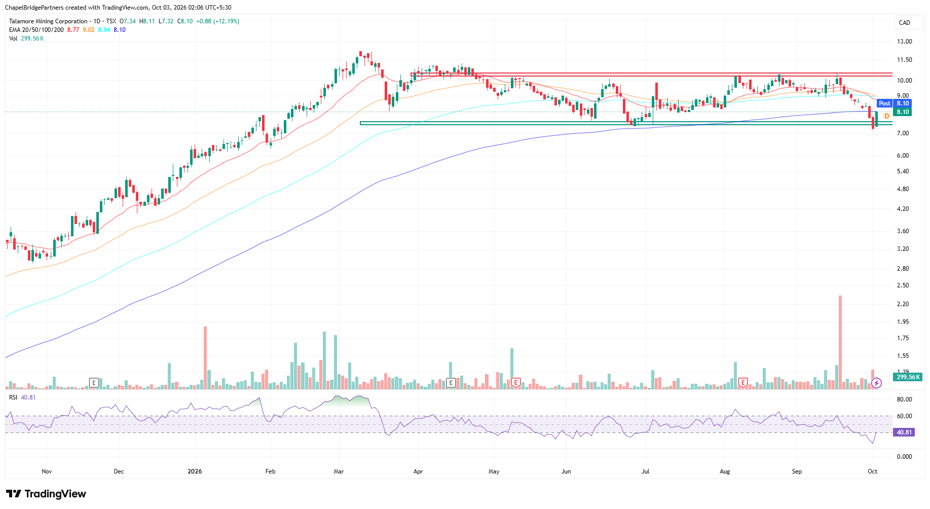
Talamore Mining Corporation (TSX:TALA) has been consolidating within a defined range, with resistance near $10.50 and support near $7.50, after advancing to a peak near $12 in March. Abnormal volume on 18 September marked the entry of sellers, and the subsequent decline carried the stock below its 20-day, 50-day and 100-day EMAs, which now cluster between $8.77 and $9.02.
On Friday, the shares rallied 12.19% to $8.10 on volume of 299.56K, rebounding from an intraday low of $7.32 near the lower boundary of the range and closing at the 200-day EMA, also at $8.10. The RSI recovered to 40.81 from lower readings earlier in the week.
A decisive breakdown below support would first test the resolve of buyers before sellers establish clear directional control. A reclaim of the 20-day, 50-day and 100-day EMAs would be the first evidence of improving structure.
Saturn Oil & Gas: Testing Resistance With a Constructive Setup
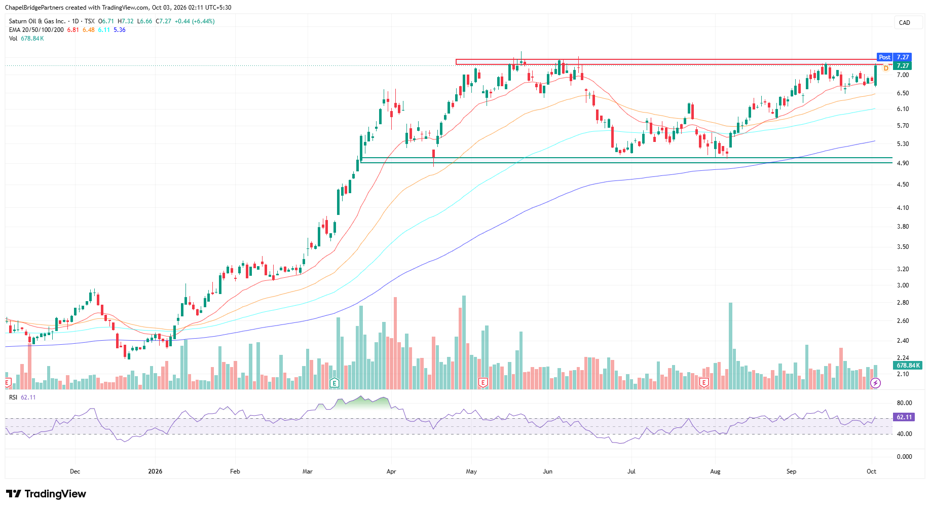
Saturn Oil & Gas Inc. (TSX:SOIL) is trading at resistance, defined by the upper boundary of its consolidation range just above $7.30, and several factors point toward a potential breakout. The stock advanced 6.44% to $7.27 on Friday, a rally from the low $2 range late last year. The moving averages are stacked in bullish order, with the 20-day EMA at $6.81, the 50-day at $6.48, the 100-day at $6.11 and the 200-day at $5.36.
The upper boundary has been tested repeatedly, and the recent pullback from resistance met with limited selling pressure. In today's session, the stock opened at $6.71, recovered from an intraday low of $6.66 and closed near the session high of $7.32, with the advance accompanied by above-average volume of 678.84K. The RSI has been forming higher highs and has moved comfortably above the critical 60 zone, at 62.11. Support remains well below, in the $4.90 to $5.00 area.
Westshore Terminals: Breakout With Stretched Momentum
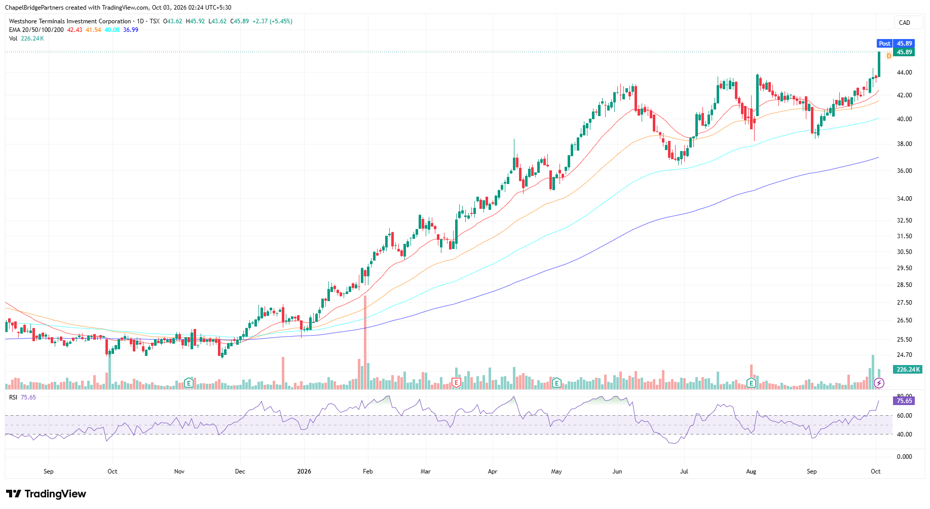
Westshore Terminals Investment Corporation (TSX:WTE) rose 5.45% to $45.89 on Friday, reaching a fresh 52-week high. The stock opened at $43.62, traded as high as $45.92 and closed near the top of the session range, clearing the $43 to $44 area that capped rallies in June, July and August.
The RSI has reached 75.65, a clear sign of an overextended rally, and the price sits about 8% above the 20-day EMA at $42.43. The remaining moving averages are in bullish sequence, at $41.54 for the 50-day, $40.08 for the 100-day and $36.99 for the 200-day. Although momentum remains strong, investors should remain alert to the possibility of profit-taking. The monthly RSI also remains in overextended territory at 74.86.
DPM Metals: Support Breach Weighs on Sentiment
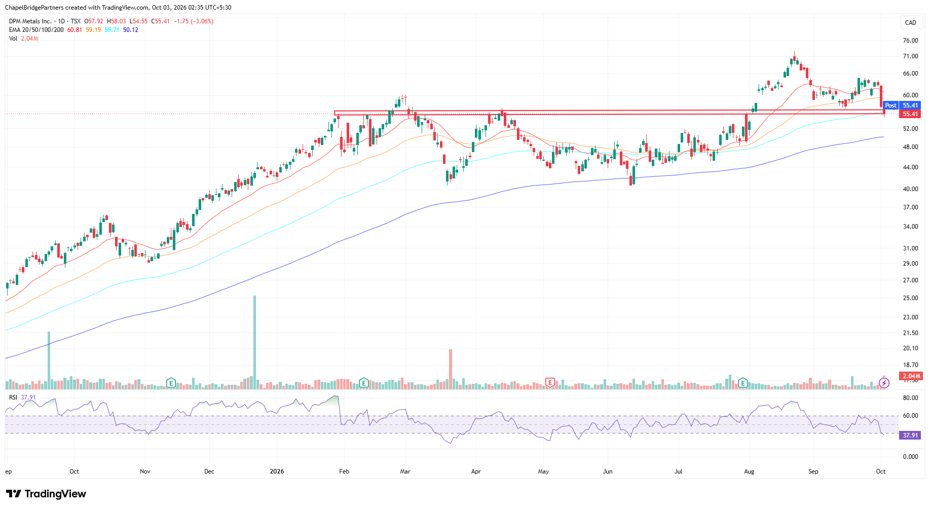
DPM Metals Inc. (TSX:DPM) declined 3.06% to $55.41 on Friday, a fall of $1.75, after opening at $57.92 and trading as low as $54.55 on volume of 2.04M. The stock closed below its 100-day EMA at $55.71 and beneath the $55 to $56.50 zone that acted as resistance earlier in the year and as support following the August breakout. The 20-day EMA at $60.81 and the 50-day EMA at $59.19 now sit above price, and the stock remains well below its late-August peak above $70.
The weekly chart of DPM Metals shows a divergence between price and RSI. The daily RSI has also fallen below the 40 level, to 37.91. A pullback from current levels cannot be ruled out, with the 200-day EMA at $50.12 the next major reference below, and sentiment in the stock remains bearish.
Conclusion
The S&P/TSX Composite Index enters the new week at a technical crossroads. The bearish EMA crossover and the failed earlier rebound from the 100-day EMA keep the daily trend contested, while the overextended monthly RSI and price-momentum divergence favour a period of consolidation rather than a rapid extension. At the stock level, Westshore Terminals and Saturn Oil & Gas display the strongest momentum, though Westshore's elevated RSI invites caution. Talamore Mining is attempting to stabilise at the foot of its range, and DPM Metals has weakened below a key support zone. Price reaction around the 100-day EMA on the index, and around the range boundaries on individual stocks, will shape the near-term technical outlook.
The Wall Street Wrap: October 2, 2026
Related post